ATRx Dots & Distribution Indicator
In the world of trading, one of the most common pitfalls is getting swept up in emotional moves. Traders often chase runaway trends only to buy at the absolute top, or panic-sell into a downtrend just before it reverses.
The ATRx Dots & Distribution Indicator is designed to identify when moves are becoming statistically stretched and vulnerable to reversal. It acts as an exhaustion and risk-assessment framework — not a lagging trend indicator.
The Core Logic – Quantifying the “Rubber Band” Effect
At its heart, the indicator calculates a powerful metric called the ATRx Multiple:
ATRx Multiple = % Price Gain ÷ Average True Range (ATR)
In simple terms, it measures how stretched a move is relative to normal volatility. When the dots appear, it signals the move is becoming climactic.
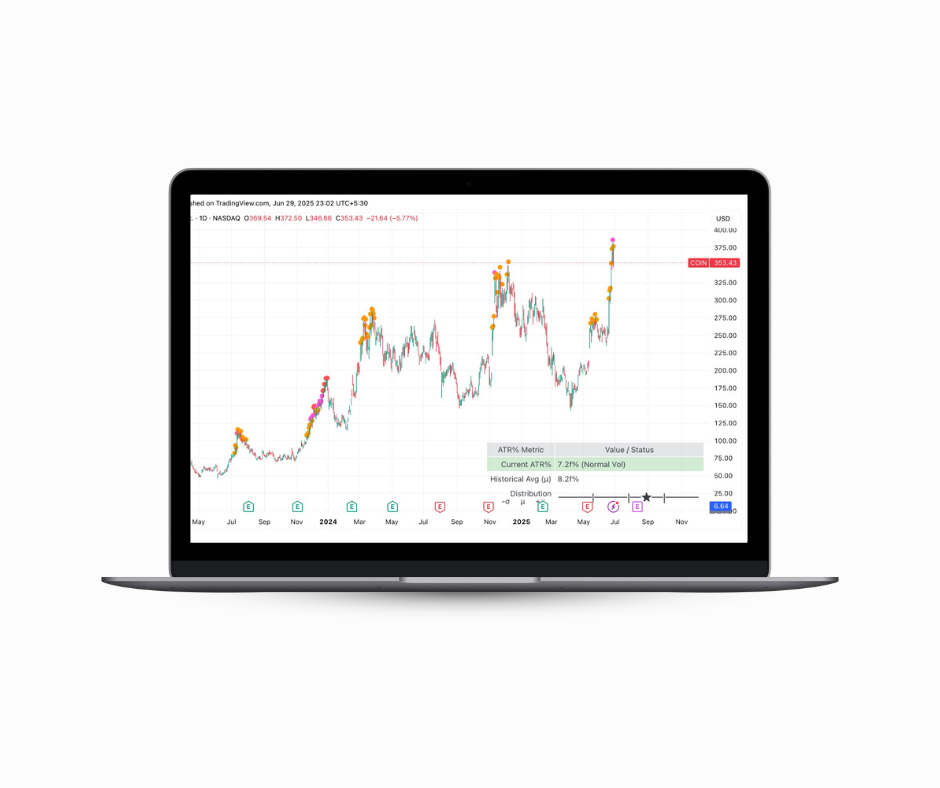
Signal Levels – Reading the Dots
- Orange Dot: Warning Shot – the trend is strong but beginning to stretch.
- Pink Dot: Serious Overextension – risk of pullback increases significantly.
- Red Dot: Climactic Exhaustion – extreme move with high reversal probability.
Distribution Table Framework
The ATRx system also categorizes market conditions using volatility distribution. This helps traders understand whether the exhaustion occurs during extreme, normal, or low-volatility regimes.
| Scenario | Market Condition | Implication |
|---|---|---|
| Climax Dot | Extreme Volatility | Highest probability reversal |
| Exhausted Trend | Normal Volatility | Likely pullback or consolidation |
| Coiling Spring | Low Volatility | Potential breakout forming |
Practical Applications
- Identify exhaustion before major reversals.
- Avoid chasing extended trends.
- Improve entry timing during volatility expansions.
- Refine exit strategies with statistical context.
This indicator is provided strictly for educational purposes. It does not guarantee trading results. Trading involves risk and past performance does not indicate future outcomes.